“InspectWrk transformed how we manage site safety inspections. The offline capability alone saved us countless hours. Our compliance rate jumped from 72% to 96% in just three months.”
Sarah Mitchell
Meridian Construction Group

Looking for downtime tracking software built around how your line runs? We provide it. InspectWrk delivers a tailored downtime solution on our mobile platform, configured to your machines, reason codes, and shifts. Book a demo to scope it.
Downtime tracking software records when, where, how long, and why equipment or production stops, and turns that into the analysis that reduces it. InspectWrk provides a downtime solution tailored to your operation, built on our mobile capture and analytics platform and configured to your machines, reason codes, and shifts.
When downtime is logged on paper or in a spreadsheet, it is recorded late and vaguely. Reasons are guessed, duration is rounded, and nobody can say which machine, shift, or cause is losing the most production, so the same downtime recurs unaddressed.
We deliver your downtime solution in five steps, from scoping your reason codes to rollout and support.
We map your machines, shifts, and downtime reason codes, so the solution matches how your operation actually loses and records production time.
We build downtime event capture on the platform with reason classification, duration, and planned versus unplanned, on any device at the line.
We configure downtime trends, equipment comparison, root cause investigation, and corrective actions, so recurring downtime is understood and reduced.
You run the solution on one line, so capture, classification, and analysis are proven before it scales.
We roll the solution across your lines and support it, with downtime dashboards live for your production team.
Downtime tracking covers capturing and analysing downtime events and their causes: event capture, reason codes, duration, availability, trends, and corrective actions. The scope below is what the platform runs, distinct from general maintenance and from OEE.
InspectWrk is the downtime capture, analysis, and action layer beside your MES or ERP, not a replacement for them. Your MES can run production and your ERP can hold orders and cost. InspectWrk owns the downtime workflow: event capture, reason codes, duration, analysis, and corrective actions. Downtime data links back to the machine and line, so the analysis and its actions sit beside your systems of record without duplicating them.
Validate four things during the pilot rather than after. First, that downtime events can be captured at the line with reason codes and duration. Second, that planned versus unplanned is distinguished. Third, that dashboards compare machines, shifts, and causes. Fourth, that recurring downtime drives corrective actions. Run one line so the capture, classify, and analyse loop is proven before it scales.
Downtime data informs production and maintenance decisions, so its integrity matters. InspectWrk enforces role-based access so operators capture events, supervisors review causes, and leadership sees losses across lines. Events, reasons, durations, and actions are logged and retained for the period your operations require, so any claim about downtime or its causes can be traced to its evidence with time and author preserved.
A downtime rollout works best line by line rather than all at once. Start with the line losing the most production, prove the capture, classify, and analyse loop there, then extend. Existing reason codes import so teams do not start empty. Because the configuration is data rather than code, each line can carry its own machines and codes while downtime rolls up to one view for production leadership.
What Downtime Tracking Software covers for your team.
Teams comparing InspectWrk to paper and spreadsheets for downtime see the difference on five points: capture, reason accuracy, duration, analysis, and recurrence.
| Capability | Without InspectWrk | With InspectWrk |
|---|---|---|
| Capture | Downtime is logged late and vaguely, so events and causes are lost. | Downtime events are captured at the line, so what stopped and why is recorded accurately. |
| Reason accuracy | Reasons are guessed, so downtime cannot be classified or trended. | Reasons are classified with codes, so downtime is analysable by cause. |
| Duration | Duration is rounded, so production losses are understated. | Duration is measured, so losses and availability are accurate. |
| Analysis | Nobody can say which machine, shift, or cause loses the most, so effort is misdirected. | Dashboards compare machines, shifts, and causes, so effort targets the biggest losses. |
| Recurrence | The same downtime recurs unaddressed, so losses persist. | Recurring downtime triggers root cause and corrective actions, so causes are removed. |
Manage every checklist in one connected workspace, capture evidence on mobile at the point of work, and let AI turn field inputs into clear, stakeholder-ready reports in minutes.
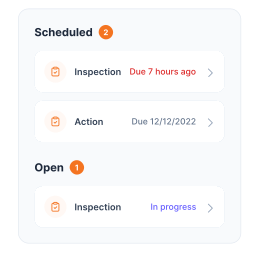
See which checklists your team has in progress across every site, jump into the same inspection with one tap, and keep field, supervisor, and back-office views in sync without sending screenshots on WhatsApp.


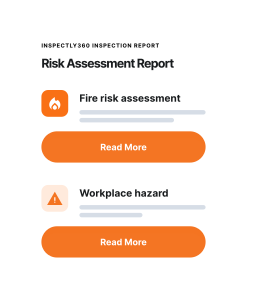
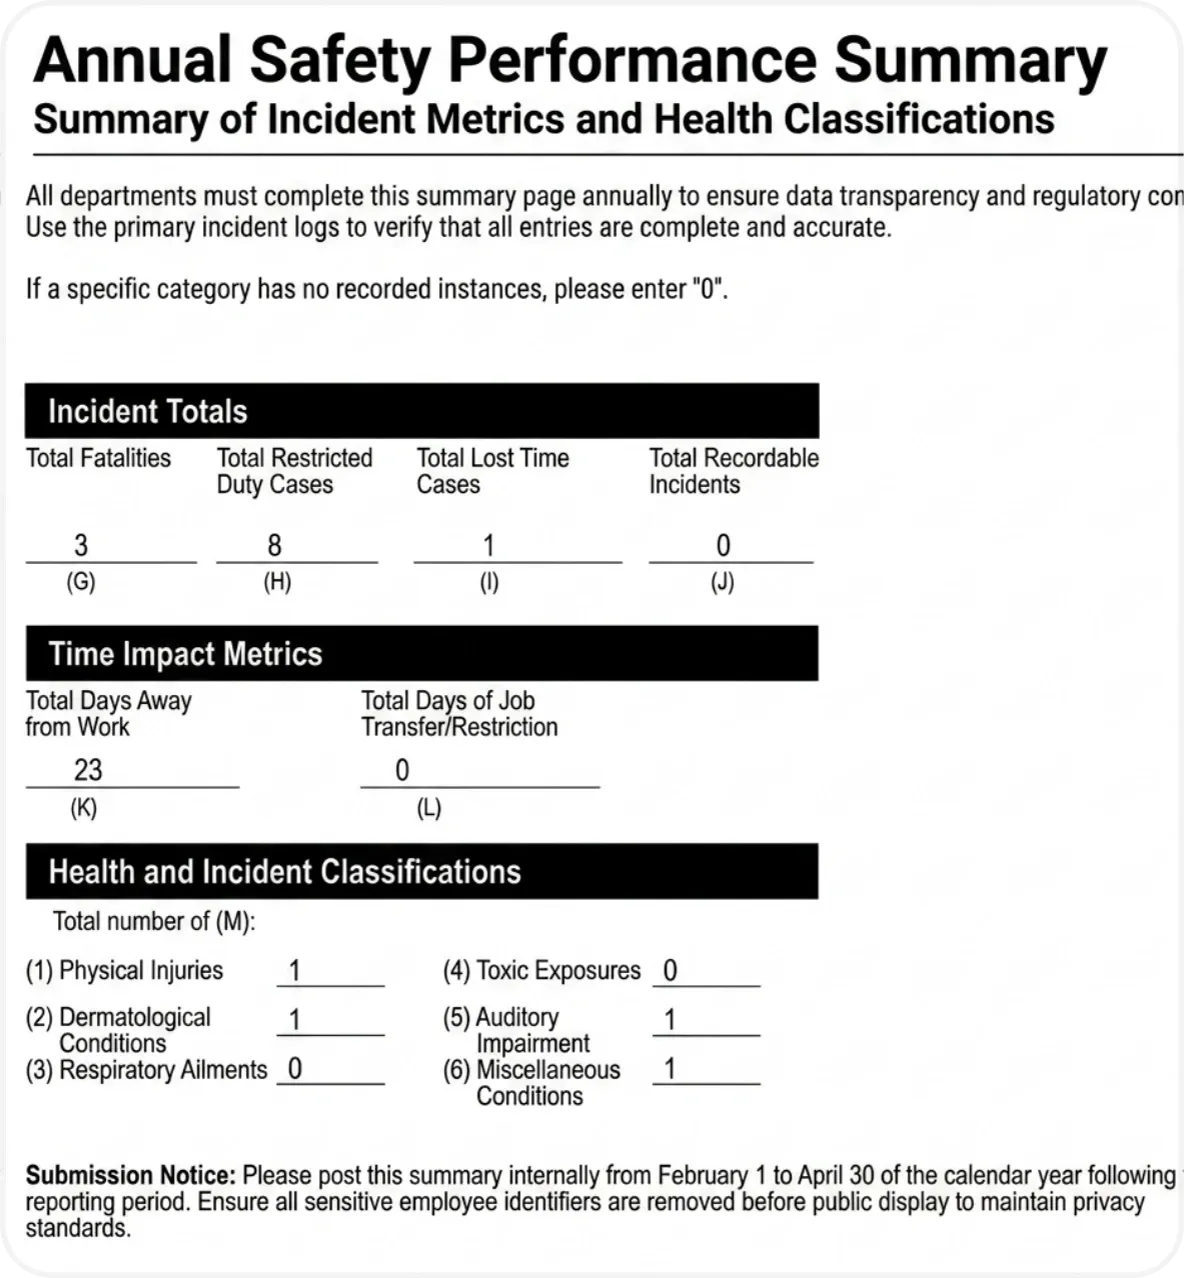


Every team reports differently. Build the report your operations, quality, or compliance leads actually want to read, share it as a branded PDF, and schedule delivery to the stakeholders who need it.


See completion, pass rate, and recurring findings across every checklist and every site, without pulling spreadsheets together at the end of the month.
What changes once downtime tracking software is standardised on InspectWrk.





“InspectWrk transformed how we manage site safety inspections. The offline capability alone saved us countless hours. Our compliance rate jumped from 72% to 96% in just three months.”
Sarah Mitchell
Meridian Construction Group
“The AI-powered defect detection has changed how we work. Our inspectors capture photos and the system flags issues we'd have missed. It's like having an expert reviewer on every site visit.”
James Chen
Pacific Manufacturing Co.
“Rolling out digital checklists across multiple projects gave us instant visibility into recurring safety issues. We now resolve critical findings in hours instead of days.”
Olivia Carter
Northbridge Infrastructure
Get started with inspection and audit checklist templates.

This Gap Analysis ISO 9001 Checklist can help you prepare for ISO 9001:2015 certification. Use this to evaluate if ...

This ISO 45001 readiness checklist can help you identify areas of your business that require further work before your external ...
They are related but distinct, and this page is deliberately about downtime, not overall equipment effectiveness. OEE software measures effectiveness across three factors: availability, performance, and quality. Downtime tracking software focuses specifically on the availability side and the reasons behind it: when equipment or production stopped, for how long, and why, classified by reason code so the causes can be analysed and reduced. Downtime data is a major input to OEE, so the two connect, but downtime tracking answers the specific question of what is stopping the line and why, in a way a single OEE number does not. InspectWrk can provide both as connected solutions, so downtime feeds OEE without either repeating the other. If your need is capturing and reducing downtime and its causes, this is the right page.
We build your downtime solution on the InspectWrk platform and configure it to your operation, rather than handing you a fixed product. Our team scopes your machines, shifts, and reason codes, configures the event capture, classification, duration, analysis, and corrective actions to match, and rolls it out with a pilot line first. Because the platform is built for configurable mobile capture, analytics, and workflows, a downtime solution tailored to your process is delivered without custom code. You get software shaped to how your operation actually loses and records production time, supported by our team, rather than the paper logs and spreadsheets where downtime is recorded too vaguely to act on.
Yes, and this is what separates useful downtime data from a list of stoppages. When a machine or line stops, the event is captured at the line with its reason classified using your reason codes, and marked as planned or unplanned, so every downtime event carries the cause rather than just the fact that it happened. That classification is what makes the data analysable: you can see how much time is lost to changeovers versus breakdowns versus material shortages, by machine and by shift, rather than a single undifferentiated downtime figure. Because reason codes are configured to your operation, the categories match how your team actually thinks about downtime, and capturing the reason at the moment, while the operator knows what happened, is far more accurate than reconstructing it later. Reason codes turn downtime from a number into an improvement roadmap.
Yes, and that is the point of tracking downtime rather than just logging it. Because every event carries a machine, a shift, a reason code, and a measured duration, the solution can compare where production time is actually being lost: which machines have the most unplanned downtime, which shift performs worst, and which causes account for the biggest losses. That comparison is what directs improvement effort at the biggest wins rather than the most visible or the most recent problem, which is how downtime effort is usually misallocated. Recurring downtime patterns can then be investigated for root cause and driven to corrective actions, so the causes are removed rather than repeated. Turning downtime into a ranked, comparable picture of losses by machine, shift, and cause is exactly what lets a production team reduce downtime systematically instead of firefighting individual stoppages.
Yes. Capturing and analysing downtime only reduces it if the causes are actually addressed, so recurring or significant downtime can be investigated for root cause and turned into tracked corrective actions, which closes the loop between measuring the problem and fixing it. A machine that repeatedly stops for the same reason, or a cause that consistently drives losses, becomes an investigation and an owned action rather than a number on a report nobody acts on. Because downtime events, their analysis, and the resulting actions sit together and roll up across lines, a production or maintenance lead can see not just where downtime happens but whether the actions taken are actually reducing it over time. Connecting downtime data to root cause analysis and corrective actions is what turns downtime tracking from a measurement exercise into a genuine driver of improved availability and reduced production loss.
Last updated: